


Reimaging the Rubin Museum’s Online Visiting Experience
Product Designer & Product Analyst
@Rubin Museum

Duration:
4 Months (2022)
My Roles:
Analyzing Surveys, User Interviews, Google Data Analysis, User Journey Map, UI Design, Prototyping, Presentation, Stakeholder Interviews
Team:
1 User Experience Designer (Me)
1 Data Analyst
1 Product Manager
Analyzing 50K+* real user data & designing on-demand online experiences.
* Retrieved from Rubin Museum of Art’s Google Analytics data
Based on data analysis and market research, we prototyped interactive online activities to foster interest in art. Meanwhile, we redesigned the website with diverse activities to keep visitors attracted and engaged. Stepping forward, we pivoted the executive goals to more feasible and affordable solutions: a personalized onboarding experience that recommends learning resources best fitting each user’s need.
Read the Complete Analysis Report →

The Marketing & Communication Team’s Challenge:
The Rubin Museum’s online pages are not catered to online users or promoted as they could be, users have a difficult time engaging and enjoying the content.
➞
Our Given Mission:
Discover current data of online visiting, directing new online visiting experiences for new visitors and return visitors on Rubin Museum.

Research Methodology
Aligned with our clients, I created and shared the UX Research roadmap with solid research questions and methodologies. My previous research experience from working with Autodesk peers helped me lead the team & execute each research study.

Creating 2 categories, and related dimensions/metrics
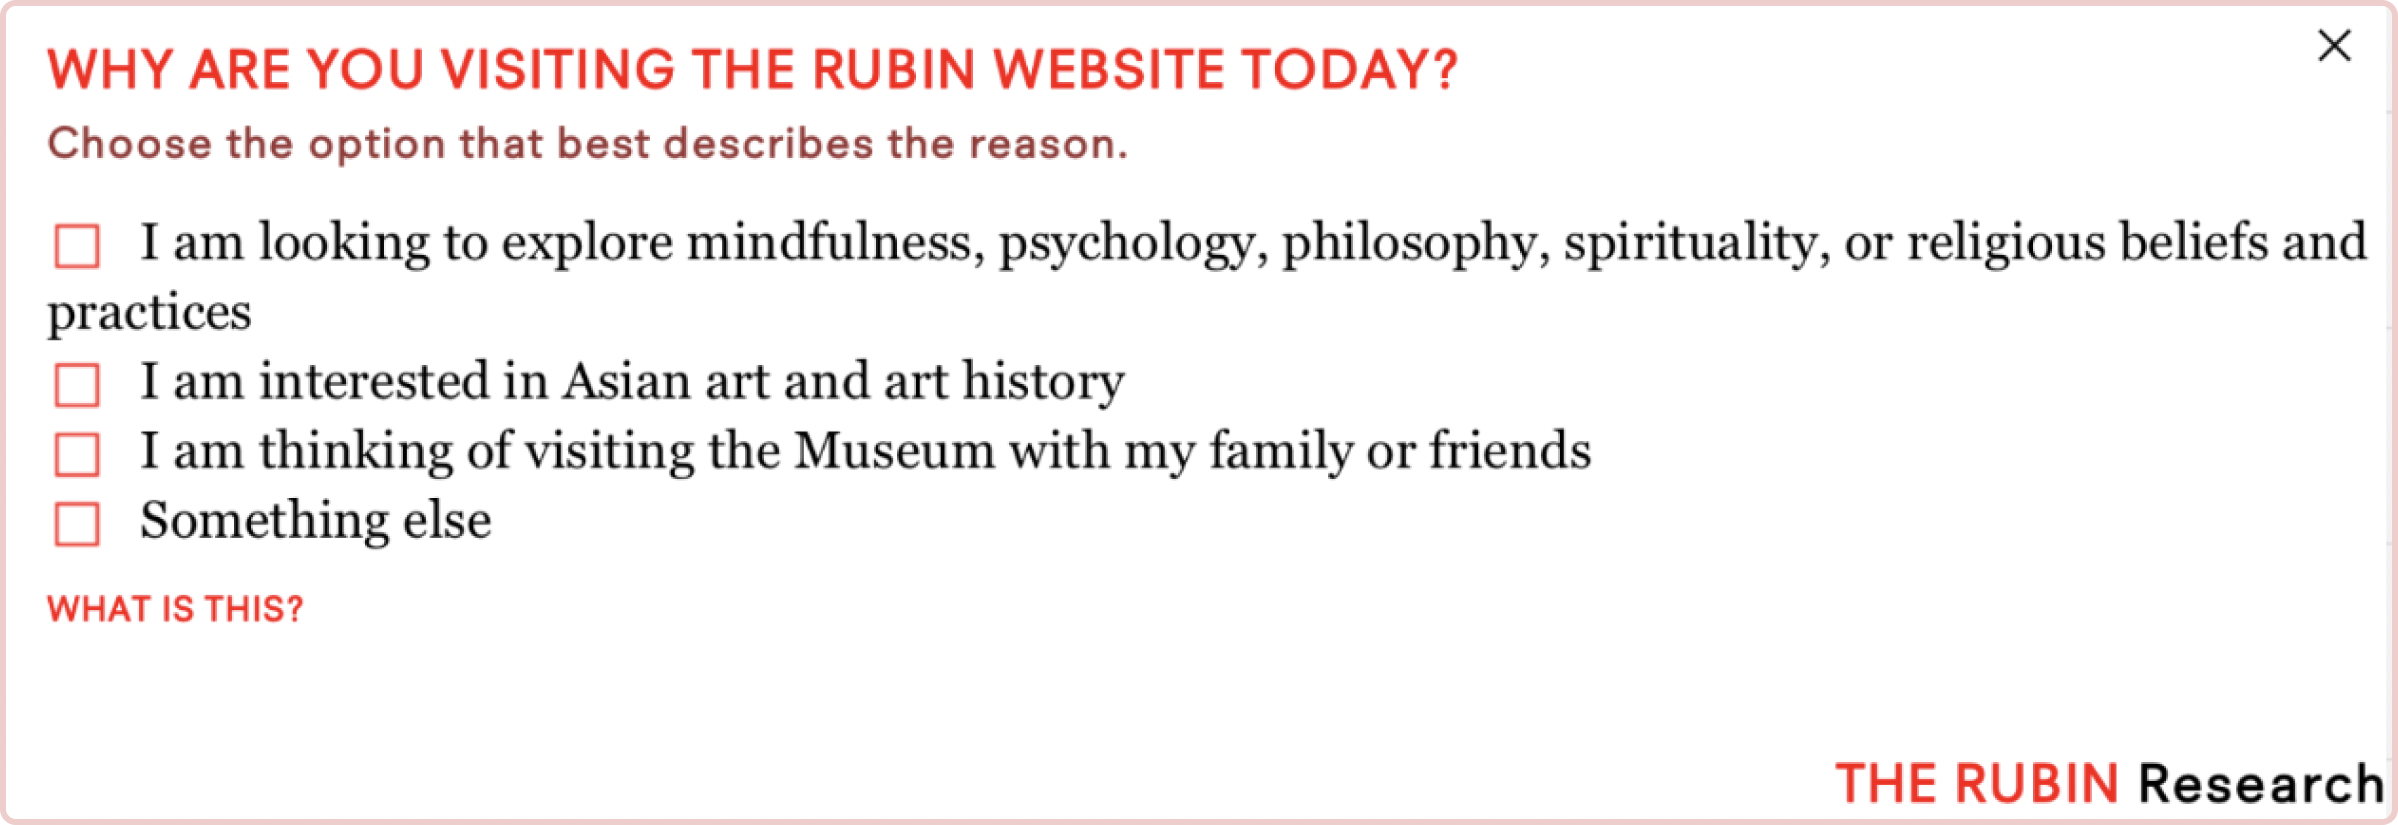
Based on the research objectives, survey prompts were extended to comprehensive dimensions and related metrics that helped the stakeholders track the real traffic of our online users.

Creating an interactive data dashboard
Based on the defined metrics, I created the interactive user data dashboard using Looker Studio, which becomes the primary source for the team to gain a thorough understanding of complex user behaviors.
What are their motivations?
We identified 4 segments of our online visitors based on their motives, looking for casual online experiences and easy-to-consume resources.
By analyzing the Google Analytics data of our current website and meeting with the Marketing and Communication Team from Rubin Museum of Art, we were able to pinpoint 4 online visitor motives: Mindfulness, Art, Social, and Other.

What are their engagement and interactions?
Our online visitors tend to interact with media content, different motives prefer to engage with certain pages.
By looking into the data from the dimensions and metrics that were created previously, we gained valuable insights on how the engagement and interactions performed by our online visitors from 4 motives.
I analyzed our direct (e.g. Asian Art Museum) and indirect competitors (e.g. Headspace) to learn from product strategies and design values. After analyzing the pros and cons, I sketched several ideas。

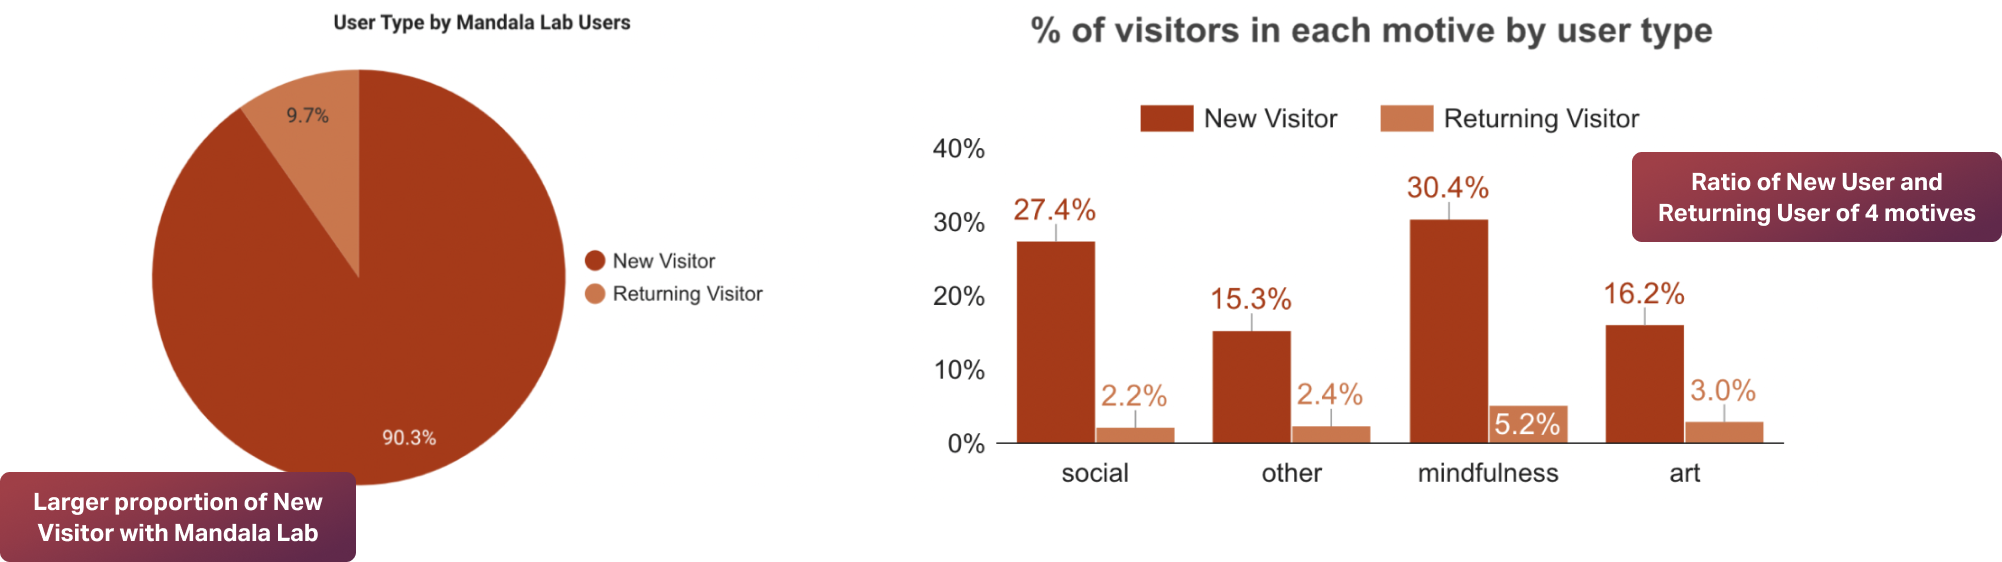
A significant disparity between new visitors and returning visitors
The gap indicates new visitors rarely re-engage with the site, there’s a need to improve user retention strategies and enhance the overall user experience for returning visitors.
How do we utilize & improve the current journey?
The current user journey causes major confusion to new visitors due to an excessive amount of information.
According to the quantitative data on the Analytics Dashboard, optimizing the process from user login to content discovery would reduce the confusion, enhance the overall experience, and offer an actionable solution.
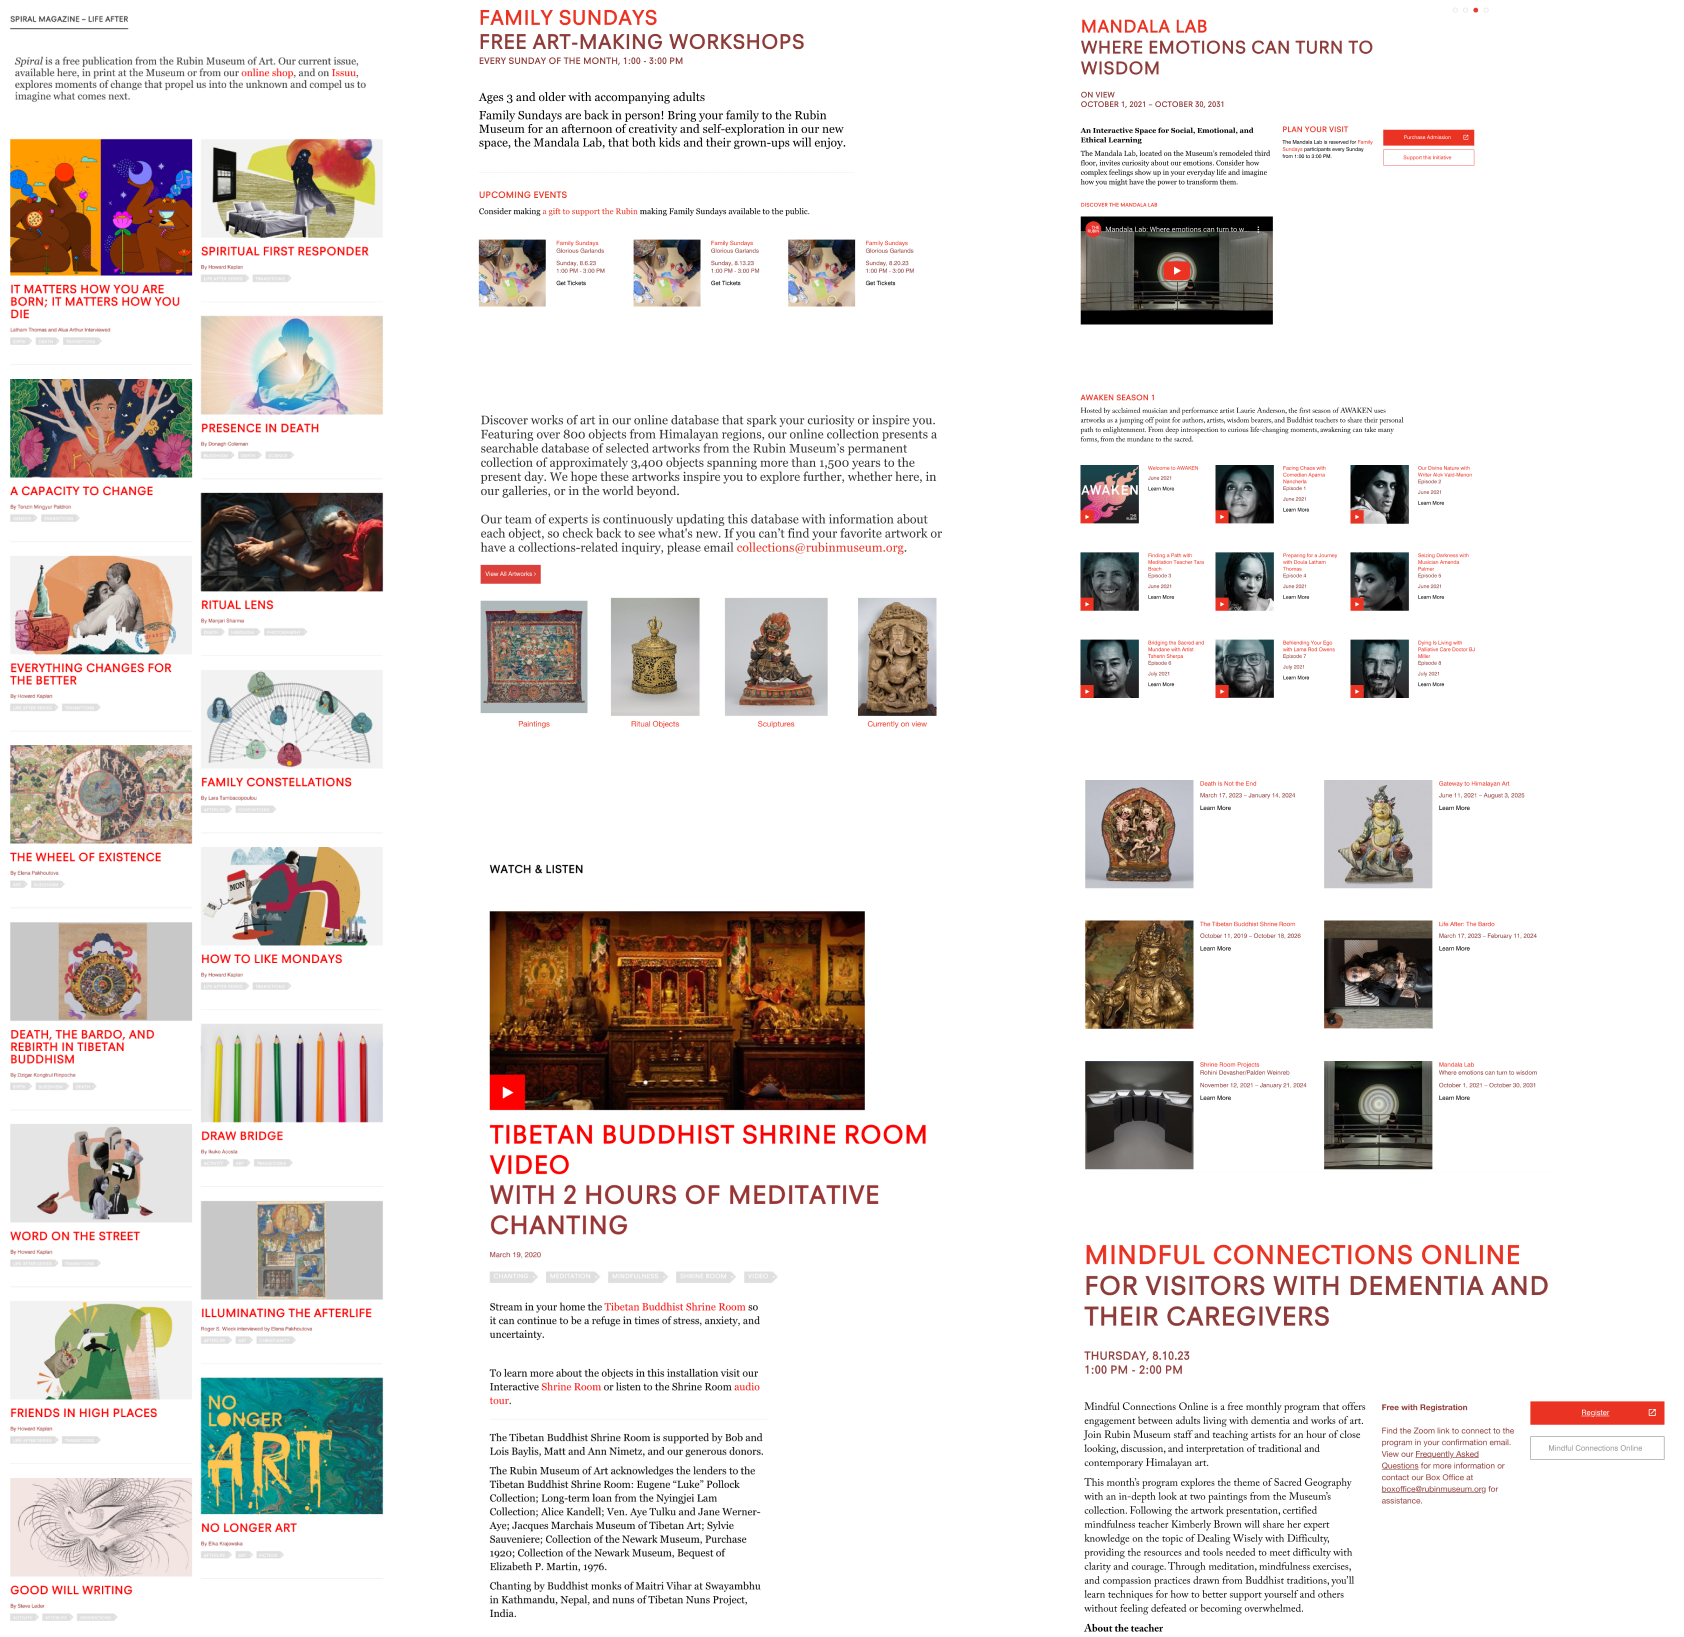
Substantial media & art databases, and diverse materials on the website could be utilized in an engaging way
By conducting interviews with 2 Marketing and Communication team stakeholders, we identified existing resources on the website that could be utilized.

Design Thinking
Analyzing and research phases lead the ideation to two scope-narrowed questions. A consensus is reached on a solid design plan by aligning design propositions with our stakeholders.
How might we engage more returning users on our website?
How might we promote the content tailoring to specific segments and make their experience more seamless?


Social Media Promotion
Promote on social media to achieve content consumption across different platforms.
Diverse Activities
Improve the re-engagement rate by promoting diverse activities.
Newsletter Subscription
Subscribe to the Newsletter, and email museum updates, new activities, events, and exhibitions to increase user re-engagement rate.


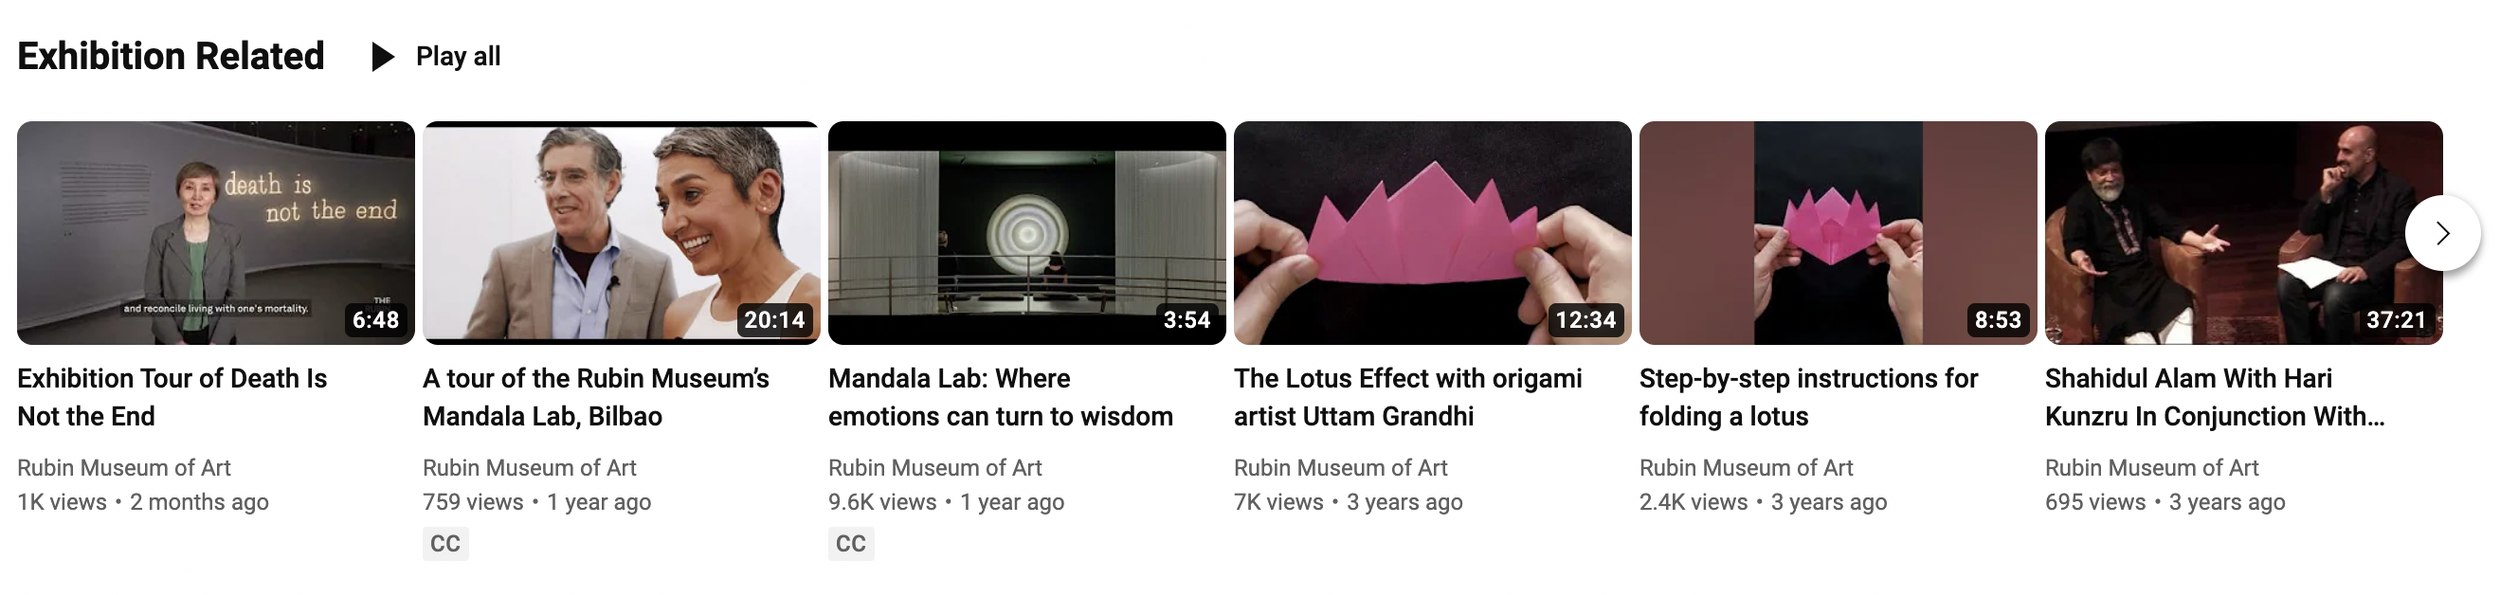
Video Distribution

Publish more video content to attract attention from all user segments and redirect them to our website.

Search to Locate
Adding the search bar, removing the jargon, streamlining the search experience
AS-IS
The museum's Communication Team appreciated the idea of new wayfinding on both devices with existing content, as it allows new visitors to access the current content much easier with less confusion.

TO-BE
⚠️
Development Challenge
Requires a considerable amount of time to create a new information architecture of the site and implement it.
💡
⚠️
Collaboration Challenge
A new interactive activities online platform requires substantial resources from inter-departmental collaboration to execute.
What’s the design solution that’s feasible in the short-term?
🚧
Analysis of our data inspired us to disclose more upfront challenges in online visiting experiences that can provide more feasible and affordable solutions.
⏱
However…
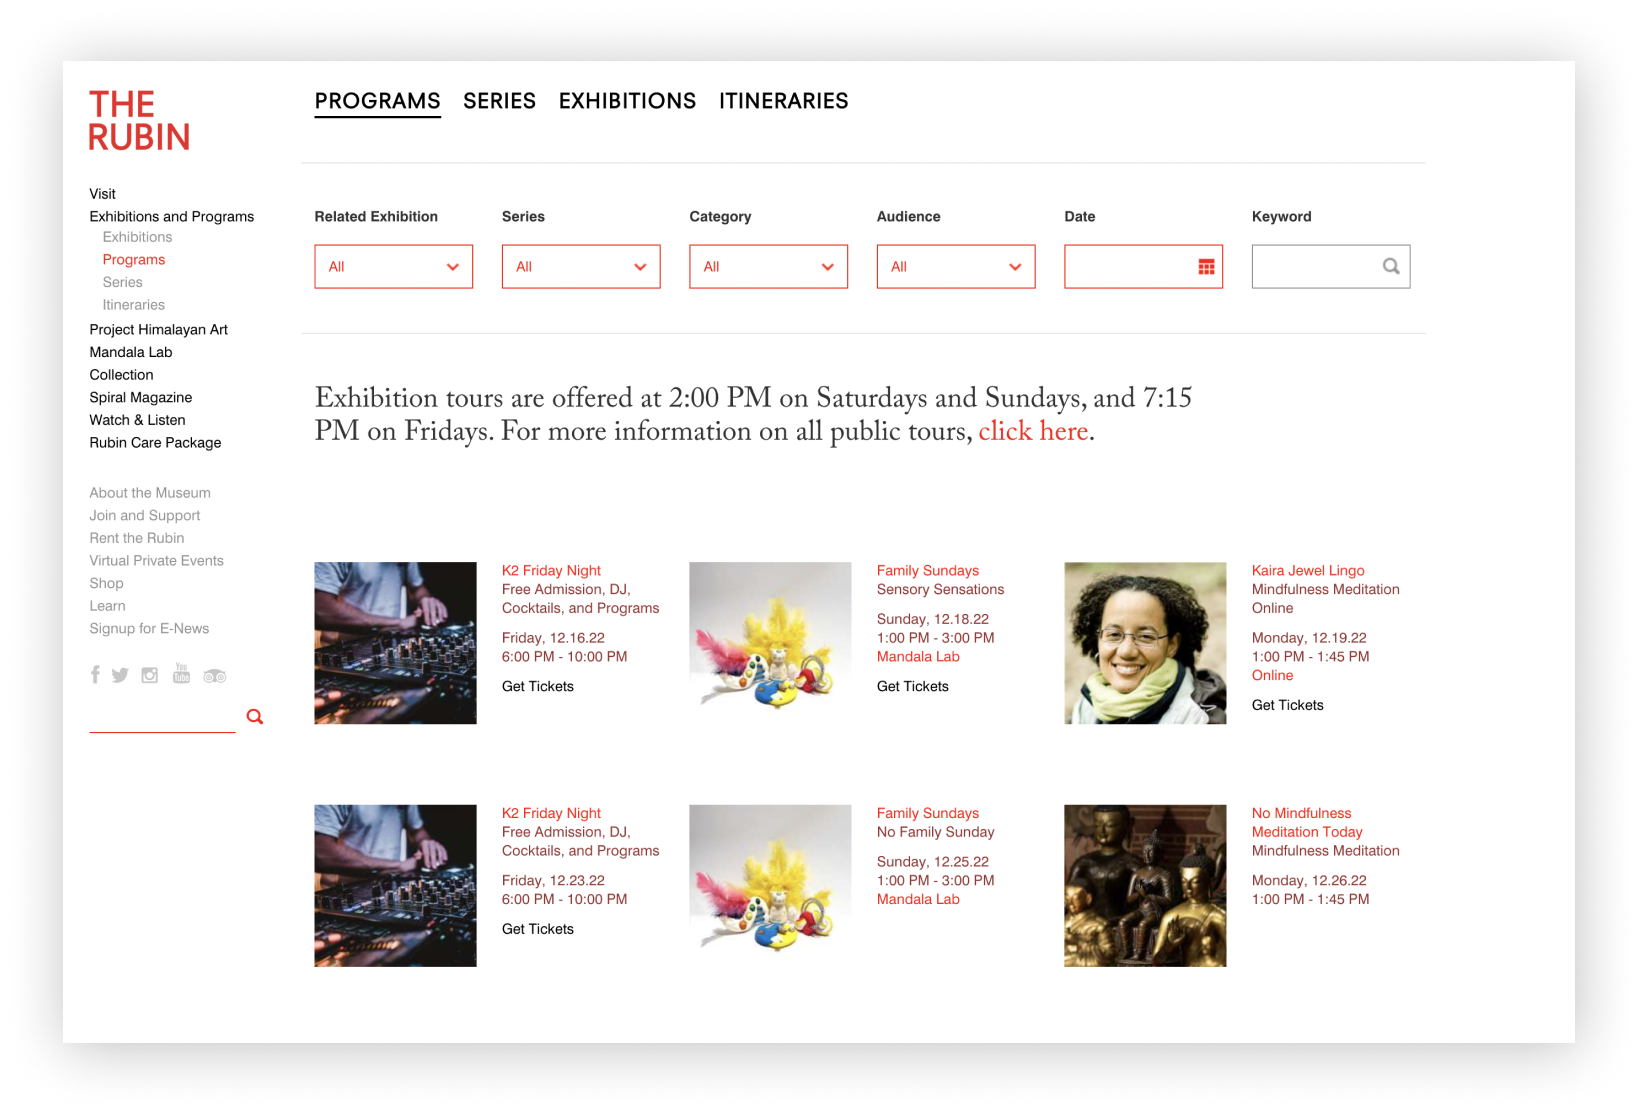
The current museum resources are scattered across the website, and not easily found by the segmented audience.
Auditing the information architecture of our current pages reveals how art, collection, mindful resources, and visiting information are nested out of order, as they were assembled by different departments. Some of the content is repeated across the page, for example ‘traveling exhibitions’ under ‘Programs’ and also under ‘Himalayan Art’.

This statistical pattern is evident in our data dashboard.
4 informal user interviews all complained:
“I don’t know where to start”
”I’m not sure of my goal till I explored the content on the site.”
Comparing behaviors across four primary pages, visitors with various motives spend similar average time on the same page, and we observe an even distribution of page visits among different motives.

Our Solution: Customized Onboarding Guide
Tailoring Online Visiting Experience with Onboarding Guide
Client’s Reaction
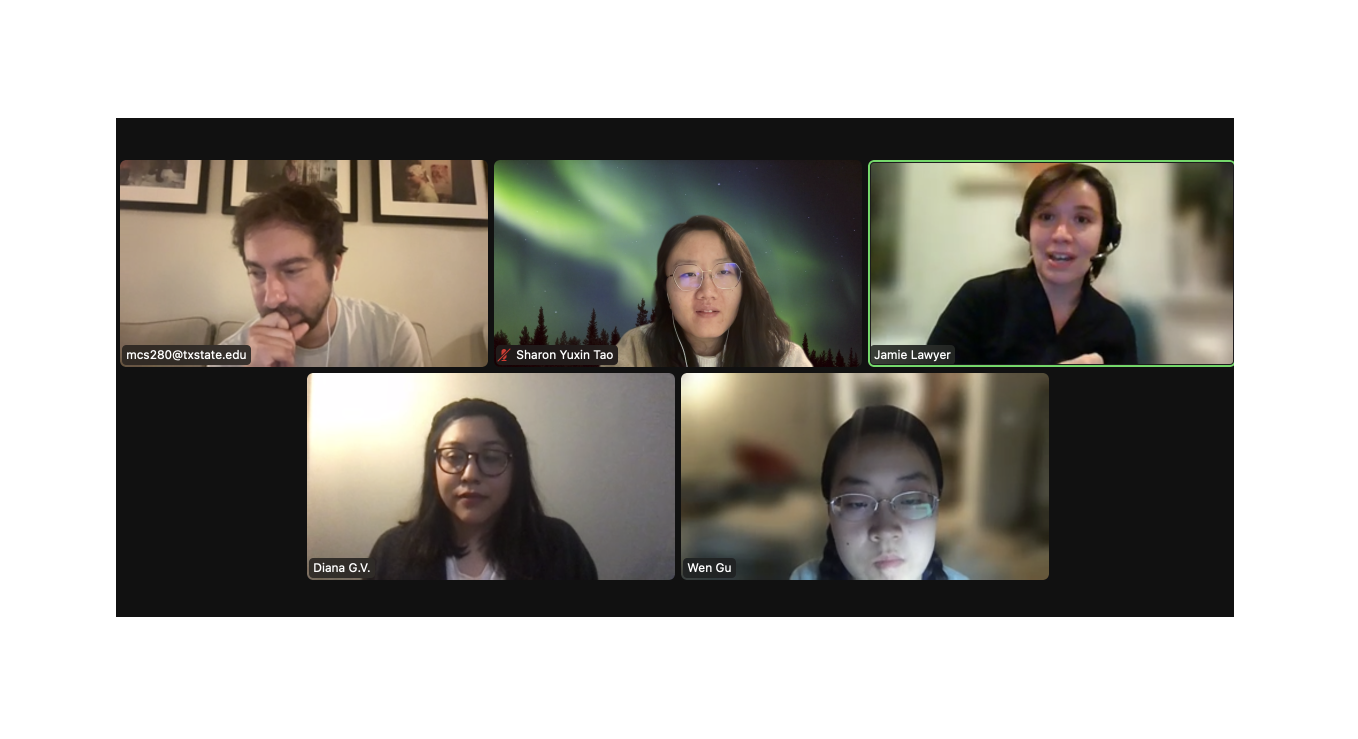
“We have GA for a long time, but we've been blind to most of the data due to lack of analysis, and finally we have some valuable insights that we can use.”
😃
Marty Spellerberg - Chief Experience Officer of The Rubin Museum of Art
Future Steps
Quantitative user journey flow:
To analyze the user path and user flow on google analytics to see the overall journey the user would take from the landing page till the exit of the website
“It's so great. I can't wait to look at the report. We got several findings that are beyond my expectations here.”
“Our original thought is to see if we can guide different motives to the right place, and your recommendations of customized onboard precisely achieved our goal to make the content more accessible to the right audience.”
Returning user’s behaviors:
Focus on the returning user’s behaviors, content interaction and engagement rate to analyze the content they’re interested in and they would interact with for multiple times
🤩
Jamie Lawyer - Chief Experience Officer of The Rubin Museum of Art
🤗
Jamie Lawyer - Chief Experience Officer of The Rubin Museum of Art
Formal user survey & interview:
To dig deeper into the qualitative data on users via interview to understand their thoughts, considerations, and feelings behind their behaviors
